The price of Binance Coin (BNB) has been in a horizontal trend after the price rise on November 12. Cryptocurrency price analysis brought by Coinidol.com.
BNB price long term forecast: in range
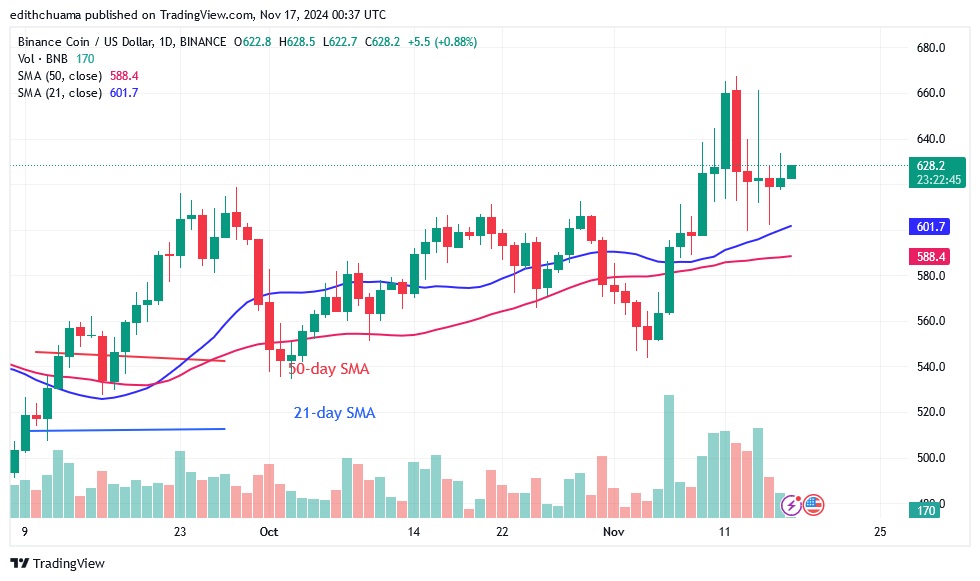
On November 12, the altcoin rose to a high of $667 before being pushed back. BNB quickly fell above the 21-day SMA and began to fluctuate. The cryptocurrency recovered above the moving average lines and is now trading between $540 and $640. The altcoin is on track to retest and break through the $640 level. If the buyers are successful, BNB will rise to its high of $720. However, if the buyers fail to break the $640 mark, the sideways trend will continue.
BNB indicator display
The 21-day SMA is above the horizontal moving average line, which serves as a support line. On November 13, a long candlestick tail pointed to the 21-day SMA support, signaling strong buying pressure. On November 14, a long wick pointed towards the $660 resistance level, indicating strong selling pressure near the previous high.

Technical indicators:
Key resistance levels – $600, $650, $700
Key support levels – $400, $350, $300
What is the next direction for BNB/USD?
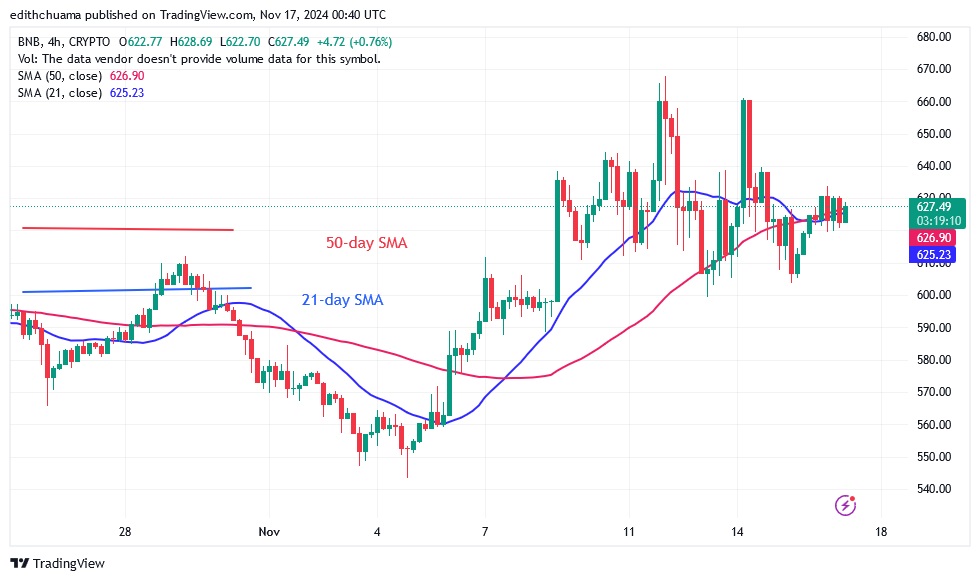
BNB is trading sideways on the 4-hour chart. The altcoin is trading between the $600 support and the $660 resistance. The price action has been restricted by the Doji candlesticks. The crypto price is falling to the current support at $600.

Disclaimer. This analysis and forecast are the personal opinions of the author, are not a recommendation to buy or sell cryptocurrency, and should not be viewed as an endorsement by CoinIdol.com. Readers should do their research before investing in funds.


