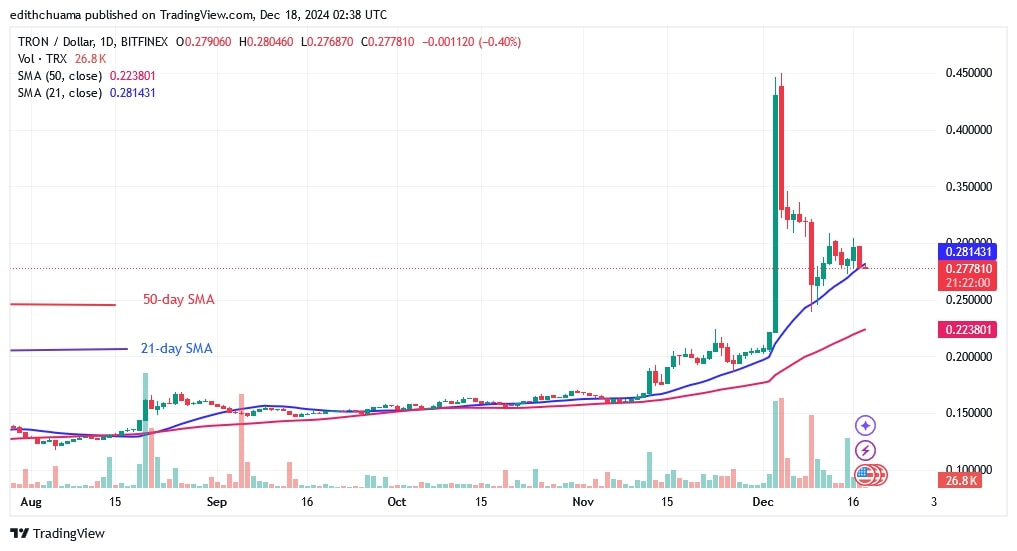
The price of TRON (TRX) has stalled at the $0.45 mark. The altcoin has declined to its low of $0.23 before recovering.
TRON price long term forecast: bullish
TRON is now trading above the $0.25 support and below the $0.35 resistance level. The downtrend has slowed down as the altcoin rises above the $0.25 support. Currently, the altcoin has suffered a setback and found support above the 21-day SMA. The uptrend will continue if the 21-day SMA support holds. The altcoin will rise and regain its previous high of $0.45.
However, selling pressure will return and TRX will fall above the 50-day SMA if the bears break below the 21-day SMA support. This corresponds to a low of $0.22. Meanwhile, the value of TRX stands at $0.285.
TRON indicator analysis
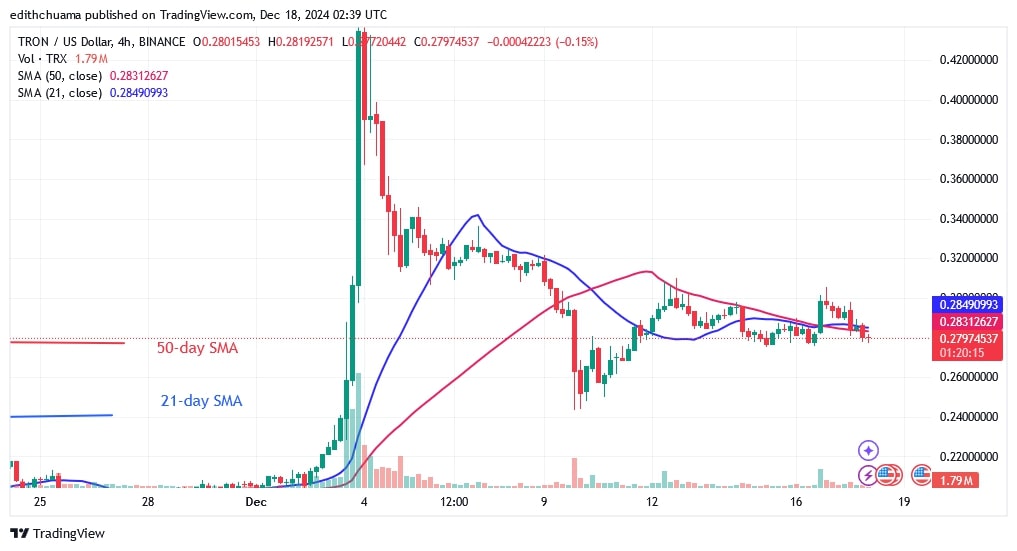
TRON’s uptrend could continue if the price bars hold above the 21-day SMA. Bulls and bears are battling for price possession above the 21-day SMA support. For example, if the bears break below the 21-day SMA support, selling pressure will continue below the 50-day SMA. The moving average lines on the 4-hour chart are horizontal due to the sideways trend.
Technical Indicators
Key Resistance Zones: $0.40, $0.45, and $0.50
Key Support Zones: $0.20, $0.15, and $0.10

What is the next move for TRON?
On the 4-hour chart, TRON’s price action has remained stable. The price movement has been defined by a small body, an uncertain candle known as a doji. The price of the cryptocurrency fluctuates in a small range of $0.25 to $0.30. Doji candlesticks have slowed down the price movement.

Disclaimer. This analysis and forecast are the personal opinions of the author, are not a recommendation to buy or sell cryptocurrency, and should not be viewed as an endorsement by CoinIdol.com. Readers should do their research before investing in funds.


